














Massachusetts Outpaces Louisiana in Halloween Travel as Salem Bookings Surge 22% and New Orleans Rental Rates Jump 29%
-
Travel, Food, Entertainment
-
-
12 mins
-
Travel and Tour World
-
Ankita Neogi Khan
-

Salem and New Orleans see Halloween rental rates surge. Compare booking data, travel costs, events and visitor advice.
Salem, Massachusetts, is recording a 22% rise in Halloween-week short-term rental bookings, while New Orleans’ French Quarter faces a 29% increase in average booked rates. AirDNA’s 12 October 2026 snapshot reveals contrasting accommodation trends as Halloween falls on Saturday, 31 October. Salem is experiencing stronger booking momentum, while New Orleans is commanding higher prices despite nearly unchanged booking volumes. Historical data adds another surprise: Halloween night is generally quieter for short-term rentals across the United States, yet Salem recorded occupancy above 80% every year from 2022 to 2025. Salem’s 400th anniversary and New Orleans’ extensive Halloween programme add further appeal. For travellers, the latest evidence highlights the importance of booking dates, transport access and comparing the full cost of accommodation.
A Tale of Two Halloween Accommodation Markets
The latest figures reveal a striking difference between the two destinations. Salem is attracting more advance short-term rental bookings at higher prices, while New Orleans’ French Quarter is experiencing stronger rate inflation without comparable growth in booked nights. AirDNA compared Halloween week in 2026, running from 26 October to 1 November, with the equivalent holiday week in 2025. The analysis uses reservations recorded on 12 October 2026 and 13 October 2025, respectively. These are forward-looking booking snapshots, not final occupancy results.
| Short-term rental indicator | Salem, Massachusetts | French Quarter, New Orleans |
|---|---|---|
| Halloween-week booked nights, year on year | +22% | Approximately −2% |
| Halloween-week average booked rate | +26% | +29% |
| October booked nights | +17% | Approximately −5% |
| October average booked rate | +18% | +14% |
| October revenue on the books | Nearly +40% | Approximately +8% |
The contrast is more revealing than a straightforward price comparison. Salem’s booked nights and rates are rising together, indicating stronger forward momentum in its short-term rental market. In the French Quarter, higher rates coincide with slightly lower October booking volume, suggesting a different balance between demand, supply and pricing.
Neither pattern establishes which destination will receive more visitors overall. AirDNA’s figures cover short-term rentals, not hotels, all accommodation types or total tourist arrivals. Moreover, the comparison uses Salem’s city market and a specific New Orleans neighbourhood, rather than two geographically equivalent destinations.
For readers, the key distinction is simple: rising accommodation prices do not automatically indicate rising visitor numbers. The figures can guide planning, but travellers still need to compare actual availability and total trip costs.
America’s Halloween Rental Market Defies the National Pattern
The most surprising finding lies beyond the two destinations. AirDNA’s historical analysis found that Halloween night generally underperformed comparable weekdays across the wider US short-term rental market between 2022 and 2025. Occupancy ran 4–12 percentage points below equivalent weekdays in the surrounding weeks, while average daily rates were 3–10% lower. Consequently, revenue per available rental night fell 13–26% below those comparable nights.
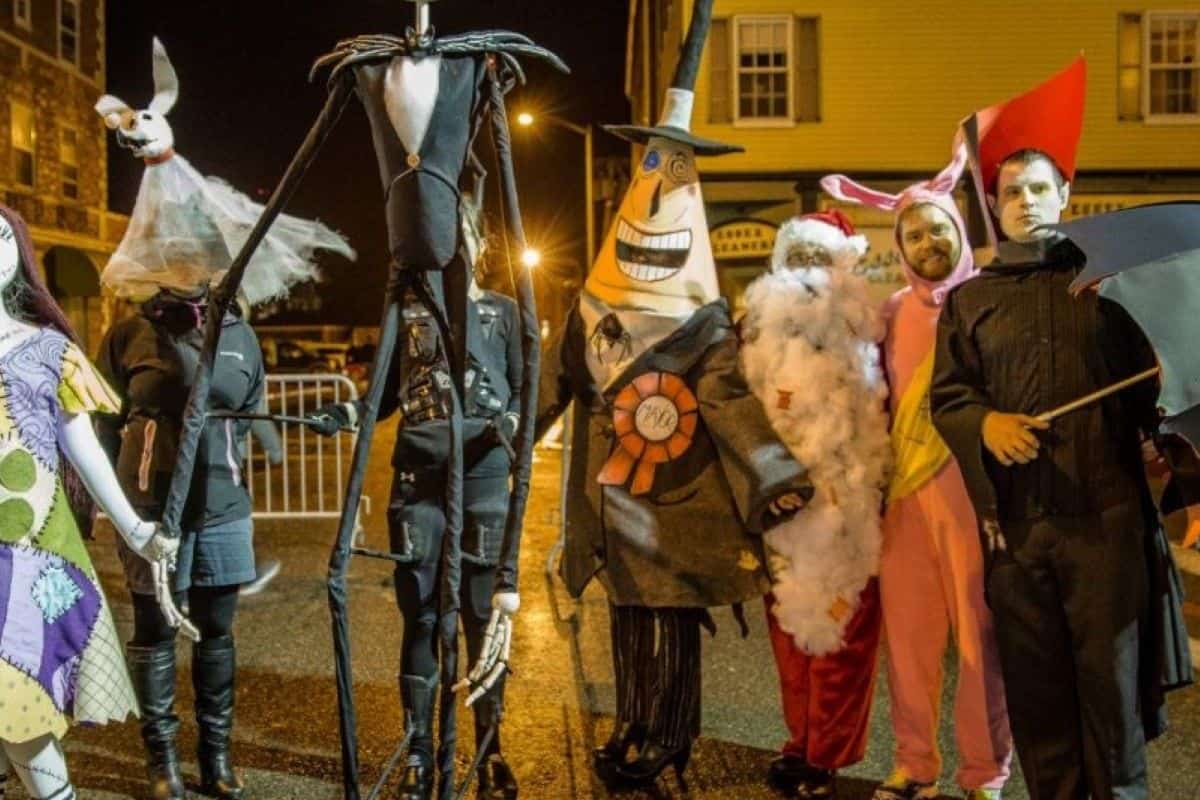
Salem and the French Quarter behave differently because Halloween itself is a major reason to visit. Salem’s witch-trial history, costumed streets and month-long celebrations create a concentrated seasonal draw. New Orleans combines ghost tours, historic architecture, nightlife and Halloween parades within an established cultural destination.
| Historical Halloween-night indicator, 2022–2025 | Salem | French Quarter |
|---|---|---|
| Rental occupancy when Halloween fell on a Monday or Tuesday | Above 80% in the period | Approximately 62–63% |
| Occupancy when Halloween fell on a Thursday | Above 80% | Approximately 76% |
| Occupancy when Halloween fell on a Friday | Above 80% | Approximately 82% |
| Salem’s 2025 Halloween-night occupancy | Approximately 93% | — |
| French Quarter’s 2025 Halloween-night occupancy | — | Approximately 82% |
The weekday effect helps explain the national anomaly. Many households stay home for local trick-or-treating, while event-driven destinations attract visitors specifically for the holiday. In Salem, more than 80% of available short-term rentals were booked on Halloween night in every year from 2022 to 2025. Occupancy exceeded 90% in three of those four years.
This evidence gives travellers a useful planning insight. A major holiday does not create identical demand everywhere. Destination-specific events, the calendar and the type of visitor experience can matter more than the holiday alone.
Salem’s Anniversary Year Intensifies October’s Appeal
Salem enters Halloween 2026 with an additional attraction: its 400th anniversary. The city’s Haunted Happenings programme runs throughout October, combining historical activities, family entertainment, performances, themed events and Halloween celebrations. Destination Salem estimates that the festival attracts more than one million visitors from around the world, although that figure is not a verified count for Halloween week alone.
The anniversary gives the city an opportunity to broaden its appeal beyond the witch-trial narrative. Its programme includes the traditional Haunted Happenings Grand Parade, seasonal entertainment and Witch Hats on the Wharf. The celebrations culminate with a 400-drone show over the North River on Halloween night, commemorating the anniversary. Destination Salem’s executive director, Ashley Judge, described the milestone as an opportunity to welcome visitors and celebrate what makes October distinctive in Salem.
The accommodation figures suggest that interest extends beyond the final weekend. October booked nights were approximately 17% ahead of the previous year’s pace by 12 October, while average booked rates had increased 18%. Revenue already on the books was nearly 40% higher at the equivalent point. These figures suggest a stronger seasonal rental market, although they cannot establish how much final revenue will ultimately be realised.
Historical booking patterns also challenge the assumption that Halloween itself is always the busiest night. In 2025, Salem’s short-term rental bookings peaked during the week beginning 6 October, ahead of Halloween week. The broader autumn season, including foliage and the month-long festival, helps distribute demand across several weeks.
For visitors, this creates a practical opportunity. Travelling earlier in October may provide a different mix of prices and availability, although no particular date guarantees cheaper accommodation. Comparing weekdays with weekends, and checking event schedules before choosing dates, can help travellers make a better-informed decision.
Salem’s Rental Availability Warning Needs Context
A separate short-term rental analysis offers a more immediate warning about Halloween-night accommodation. AirROI reported on 24 September that all 81 active Salem listings in its sample were unavailable for 31 October. It also found that 77.6% of Halloween-night listing nights were unavailable by 31 August, compared with 74.1% at the equivalent point in 2025.
Those findings require careful interpretation. AirROI’s sample is not a census of every rental in Salem, and an unavailable night does not necessarily mean a confirmed guest booking. Hosts may block dates for personal use, maintenance or other reasons. Nevertheless, the results indicate that travellers searching late could face limited choices within the sample.
AirROI also reported that 99% of its sampled listings were unavailable for Friday, 30 October, by 24 September. Its findings illustrate how quickly the most desirable dates can become difficult to secure, particularly when Halloween falls on a Saturday.
| Salem availability indicator | Reported result | What it means |
|---|---|---|
| Listings sampled on 24 September | 81 | A limited sample, not the entire city market |
| Halloween-night listings unavailable on 24 September | 100% of the sample | No listing in that sample appeared available |
| Halloween-night listing nights unavailable by 31 August | 77.6% | Includes potentially host-blocked dates |
| Equivalent 2025 figure by 31 August | 74.1% | Suggests earlier unavailability in 2026 |
| Friday, 30 October, unavailable in the sample | 99% | Indicates limited sampled options |
Travellers should therefore check several accommodation types rather than interpreting one platform’s sample as the entire market. Hotels, licensed guesthouses and properties in neighbouring communities may provide alternatives, but their availability and prices need to be checked directly. Visitors should also verify transport connections before choosing accommodation farther from the centre.
New Orleans’ Rental Rates Rise as Supply Contracts
New Orleans presents a different set of pressures. The French Quarter’s Halloween-week booked nights were approximately 2% below the previous year’s snapshot, yet average booked rates increased 29%. Across October, booked nights were approximately 5% lower and rates 14% higher, leaving revenue on the books around 8% ahead.
AirDNA also reported that French Quarter available listing nights were down approximately 8% in early October compared with the previous year. Across the broader September-to-November period in 2025, available listing nights fell around 8%, while demand declined approximately 12%. So far in 2026, AirDNA’s reported available listing nights were down approximately 15%, while demand was down around 4%.
These figures point to a rental market experiencing reduced supply alongside softer demand. A smaller pool of available nights can influence prices, but it does not prove that supply changes alone caused the rate increase. The mix of properties, length of stay, reservation timing and host pricing decisions may also contribute.
Regulation forms part of the wider context. New Orleans has tightened its approach to short-term rental permits, zoning and operating conditions in recent years. The city’s comprehensive zoning ordinance specifies requirements for permitted commercial rentals, including displaying permit information and adhering to occupancy limits. However, the relationship between regulation and individual nightly prices cannot be established from the booking data alone.
For visitors, the practical implication is to compare the French Quarter with other parts of the city. A higher average rate in one neighbourhood does not mean every New Orleans property has become more expensive by the same percentage. Location, transport, property type and the full booking cost remain essential considerations.
The Saturday Holiday Changes Booking Comparisons
Halloween falls on Saturday, 31 October, in 2026. That creates a natural opportunity for weekend breaks, but it also complicates year-on-year comparisons because Halloween fell on Friday in 2025. A comparison between the same calendar dates can produce a different result from a comparison between the same weekdays.
AirDNA found that Salem’s booked nights for 31 October were approximately 19% ahead of the equivalent date in 2025, with rates about 20% higher. However, bookings for Halloween Saturday were approximately 57% ahead of the same Saturday in the previous year’s holiday-week pattern. The unusually weak Saturday after Halloween in 2025 partly explains that larger increase.
The French Quarter showed a similar calendar effect, though less pronounced. AirDNA reported that bookings for Saturday, 31 October, were approximately 10% higher than the comparable Saturday in 2025, with rates around 28% higher. The data also showed increased booking activity for Sunday, 1 November, suggesting that some demand is extending into the day after Halloween.
These comparisons matter because a large percentage increase can reflect both genuine demand growth and an unusually weak comparison period. Readers should focus on the full set of indicators rather than a single headline figure.
For visitors, flexible dates remain useful. A trip that begins earlier or ends later may offer different options, while weekday stays can alter the total cost. However, the only reliable way to determine value is to compare actual quotes for the complete itinerary.
Hotel Performance Must Remain a Separate Measure
The rental figures cannot establish whether hotels in Salem or New Orleans are experiencing the same price increases. Hotels use different measures, including average daily rate, occupancy and revenue per available room. Each answers a different question about accommodation performance.
| Industry measure | Meaning | Relevance to travellers |
|---|---|---|
| Short-term rental booked rate | Average rate associated with booked rental nights | Tracks pricing in the rental segment |
| Hotel average daily rate | Average room revenue per room sold | Indicates the price paid for sold hotel rooms |
| Hotel occupancy | Share of available rooms occupied | Measures use of hotel capacity |
| Hotel revenue per available room | Room revenue divided by available rooms | Reflects both room pricing and occupancy |
A hotel market can record rising average daily rates while occupancy falls. Revenue per available room can also increase because more rooms sell, even if prices change only modestly. Consequently, rental rate inflation should not be used as a substitute for hotel-market evidence.
A stronger final comparison would obtain hotel ADR, occupancy and RevPAR for Salem-area hotels and New Orleans during equivalent Halloween-week periods in 2025 and 2026. Until those matched statistics are available, the article should report the AirDNA figures strictly as short-term rental data.
This distinction is useful for travellers comparing accommodation options. A rental may offer more space for families or groups, while a hotel may provide services and a more predictable check-in experience. Neither is automatically better value: the full price, cancellation policy, location and transport costs determine the final comparison.
New Orleans’ Visitor Economy Adds Economic Weight
The accommodation figures sit within a substantial tourism economy. New Orleans & Company reported that the city welcomed 19.46 million visitors in 2025, a 2% increase from 19.08 million in 2024. Estimated visitor spending reached $10.8 billion, up from $10 billion in the previous year. The organisation said tourism supported more than 85,000 jobs and careers.
| New Orleans tourism indicator | 2024 | 2025 |
|---|---|---|
| Annual visitors | 19.08 million | 19.46 million |
| Estimated visitor spending | $10.0 billion | $10.8 billion |
| Visitor growth year on year | — | Approximately 2% |
| Increase in estimated spending | — | $800 million |
| Tourism-supported jobs and careers | — | More than 85,000 |
The figures demonstrate the importance of tourism to New Orleans, but they cannot establish how much visitors spent in the French Quarter during Halloween. Nor can they be compared directly with Salem’s seasonal visitor estimates without equivalent definitions, geographical coverage and measurement methods.
The distinction matters for industry reporting. Accommodation revenue is only one component of visitor spending, alongside restaurants, retail, entertainment, transport and attractions. A market with higher nightly rates does not necessarily generate more total visitor expenditure, especially if the number of stays changes.
For Salem, the month-long festival and anniversary celebrations provide a clear seasonal draw. For New Orleans, the wider visitor economy extends beyond Halloween into food, music, heritage and year-round cultural tourism. These different demand profiles help explain why the two destinations require separate market analysis.
Salem’s Transport Restrictions Could Change the Value Equation
Accommodation price is only one part of the cost of visiting Salem on Halloween. The city has announced extensive road closures for Saturday, 31 October, with downtown streets scheduled to close to traffic no later than noon. Officials warn that closures could begin earlier if crowd levels or public safety require them.
The MBTA Salem parking garage is scheduled to prevent vehicle entry and exit from 6 pm until 1 am. The city recommends travelling by commuter rail or Salem Ferry and identifies free parking at 108 Jefferson Avenue on Saturdays, Sundays and Indigenous Peoples’ Day. Visitors should check official guidance before departure because arrangements may change.
| Travel consideration | Official guidance for Halloween 2026 | Why it matters |
|---|---|---|
| Downtown road closures | Planned from noon or earlier on 31 October | Driving directly into central Salem may be impractical |
| MBTA Salem garage | No vehicle entry or exit, 6 pm–1 am | Drivers must plan parking and departure times |
| Commuter rail | Recommended by the city | Avoids much of the central traffic pressure |
| Salem Ferry | Recommended alternative | Offers another way to reach the destination |
| Free visitor parking | 108 Jefferson Avenue on specified dates | Check availability, restrictions and walking route |
Visitors staying outside the centre should factor journey time and transport costs into their accommodation decision. A cheaper room farther away may lose its advantage if transfers, parking or delays increase the total expense. Rideshare passengers should also verify designated pick-up points and access restrictions.
For international visitors or those unfamiliar with the region, this is particularly important. The cheapest advertised nightly rate may not be the most economical choice once transport and event access are considered.
New Orleans Extends the Experience Beyond Halloween
New Orleans offers a broader programme of seasonal activity, allowing visitors to build an itinerary around more than Halloween night. The Krewe of BOO! parade took place on Saturday, 24 October, at 6.30 pm, with organisers projecting more than 100,000 spectators along the route. The event featured more than 600 riders across 15 floats, alongside marching and performance groups.
The parade’s timing gives visitors an additional reason to consider a longer stay or an earlier arrival. Other activities associated with the weekend included a zombie run, cultural events and performances. Travellers should confirm the dates of individual events through official listings, particularly when planning trips around ticketed activities.
The French Quarter’s architecture, restaurants, live music and ghost tours also provide options beyond organised Halloween events. That broader experience distinguishes New Orleans from a trip focused mainly on one night or a single festival location.
Nevertheless, visitors should avoid assuming that every event takes place in the French Quarter. Parade routes and activities can extend into downtown and neighbouring districts, affecting journey times and accommodation convenience. Checking event locations before booking can help travellers choose a suitable base.
Rental Rules and Booking Checks Deserve Attention
New Orleans’ short-term rental market operates under local zoning and permitting requirements. The city’s comprehensive zoning ordinance sets out conditions for commercial short-term rentals, including permit display and occupancy limits. Visitors should verify that a property is lawfully advertised and that its stated occupancy matches the needs of their group.
In Salem, traffic controls and seasonal parking restrictions make location and access especially important. Visitors should review the city’s official transport information rather than rely solely on accommodation descriptions. Event access can change during October, and a property advertised as central may not offer straightforward vehicle access on Halloween night.
Both destinations reward careful comparison. Travellers should review taxes, cleaning fees, minimum-night requirements, cancellation terms and the total cost for the complete stay. They should also confirm check-in arrangements and transport options before paying.
These precautions are more useful than relying on percentage changes alone. A 29% rise in an average booked rate does not tell a visitor what a particular property will cost, while a high unavailability figure does not prove that every hotel or rental is sold out.
Which Destination Offers Better Value?
The available data does not establish a universal winner. Salem’s short-term rental market shows stronger booking momentum, while the French Quarter is recording a steeper increase in Halloween-week rates. Yet neither statistic determines the final cost of a holiday.
A meaningful comparison requires actual accommodation quotes for the same dates, party size, length of stay and cancellation conditions. Travellers should include taxes, cleaning charges, parking, transport and planned activities. Hotel quotes must also be compared separately from rental prices.
For visitors prioritising Salem’s anniversary celebrations, historical attractions and Halloween atmosphere, early planning and flexible dates are particularly valuable. Those choosing New Orleans can compare the French Quarter with other neighbourhoods and build a longer itinerary around music, food, architecture and seasonal events.
The broader lesson is that booking momentum, accommodation pricing and visitor spending are connected but distinct measures. Understanding that distinction helps travellers make better decisions and gives the tourism industry a more reliable basis for interpreting seasonal demand.
What Visitors Should Know Before Booking
Salem and New Orleans demonstrate how Halloween can produce very different accommodation-market outcomes. Salem’s stronger booking growth and historically high Halloween-night occupancy indicate substantial seasonal pressure, while the French Quarter’s rising rates coincide with relatively flat holiday-week bookings and a reported contraction in available rental nights.
For visitors, the most useful response is to compare actual prices, check transport arrangements and consider alternative dates or neighbourhoods. Salem’s road restrictions deserve particular attention, while New Orleans visitors should verify event locations and rental compliance. The October 12 AirDNA figures remain a dated booking snapshot, not a live availability report. The smartest trip combines early planning with verified prices, realistic transport arrangements and a clear understanding of what the data actually measures.
The post Massachusetts Outpaces Louisiana in Halloween Travel as Salem Bookings Surge 22% and New Orleans Rental Rates Jump 29% appeared first on Travel and Tour World